The Analytics Overview page provides a comprehensive view of your website's cookieless analytics data. This guide shows you how to interpret and use this information.
Accessing the Overview Page
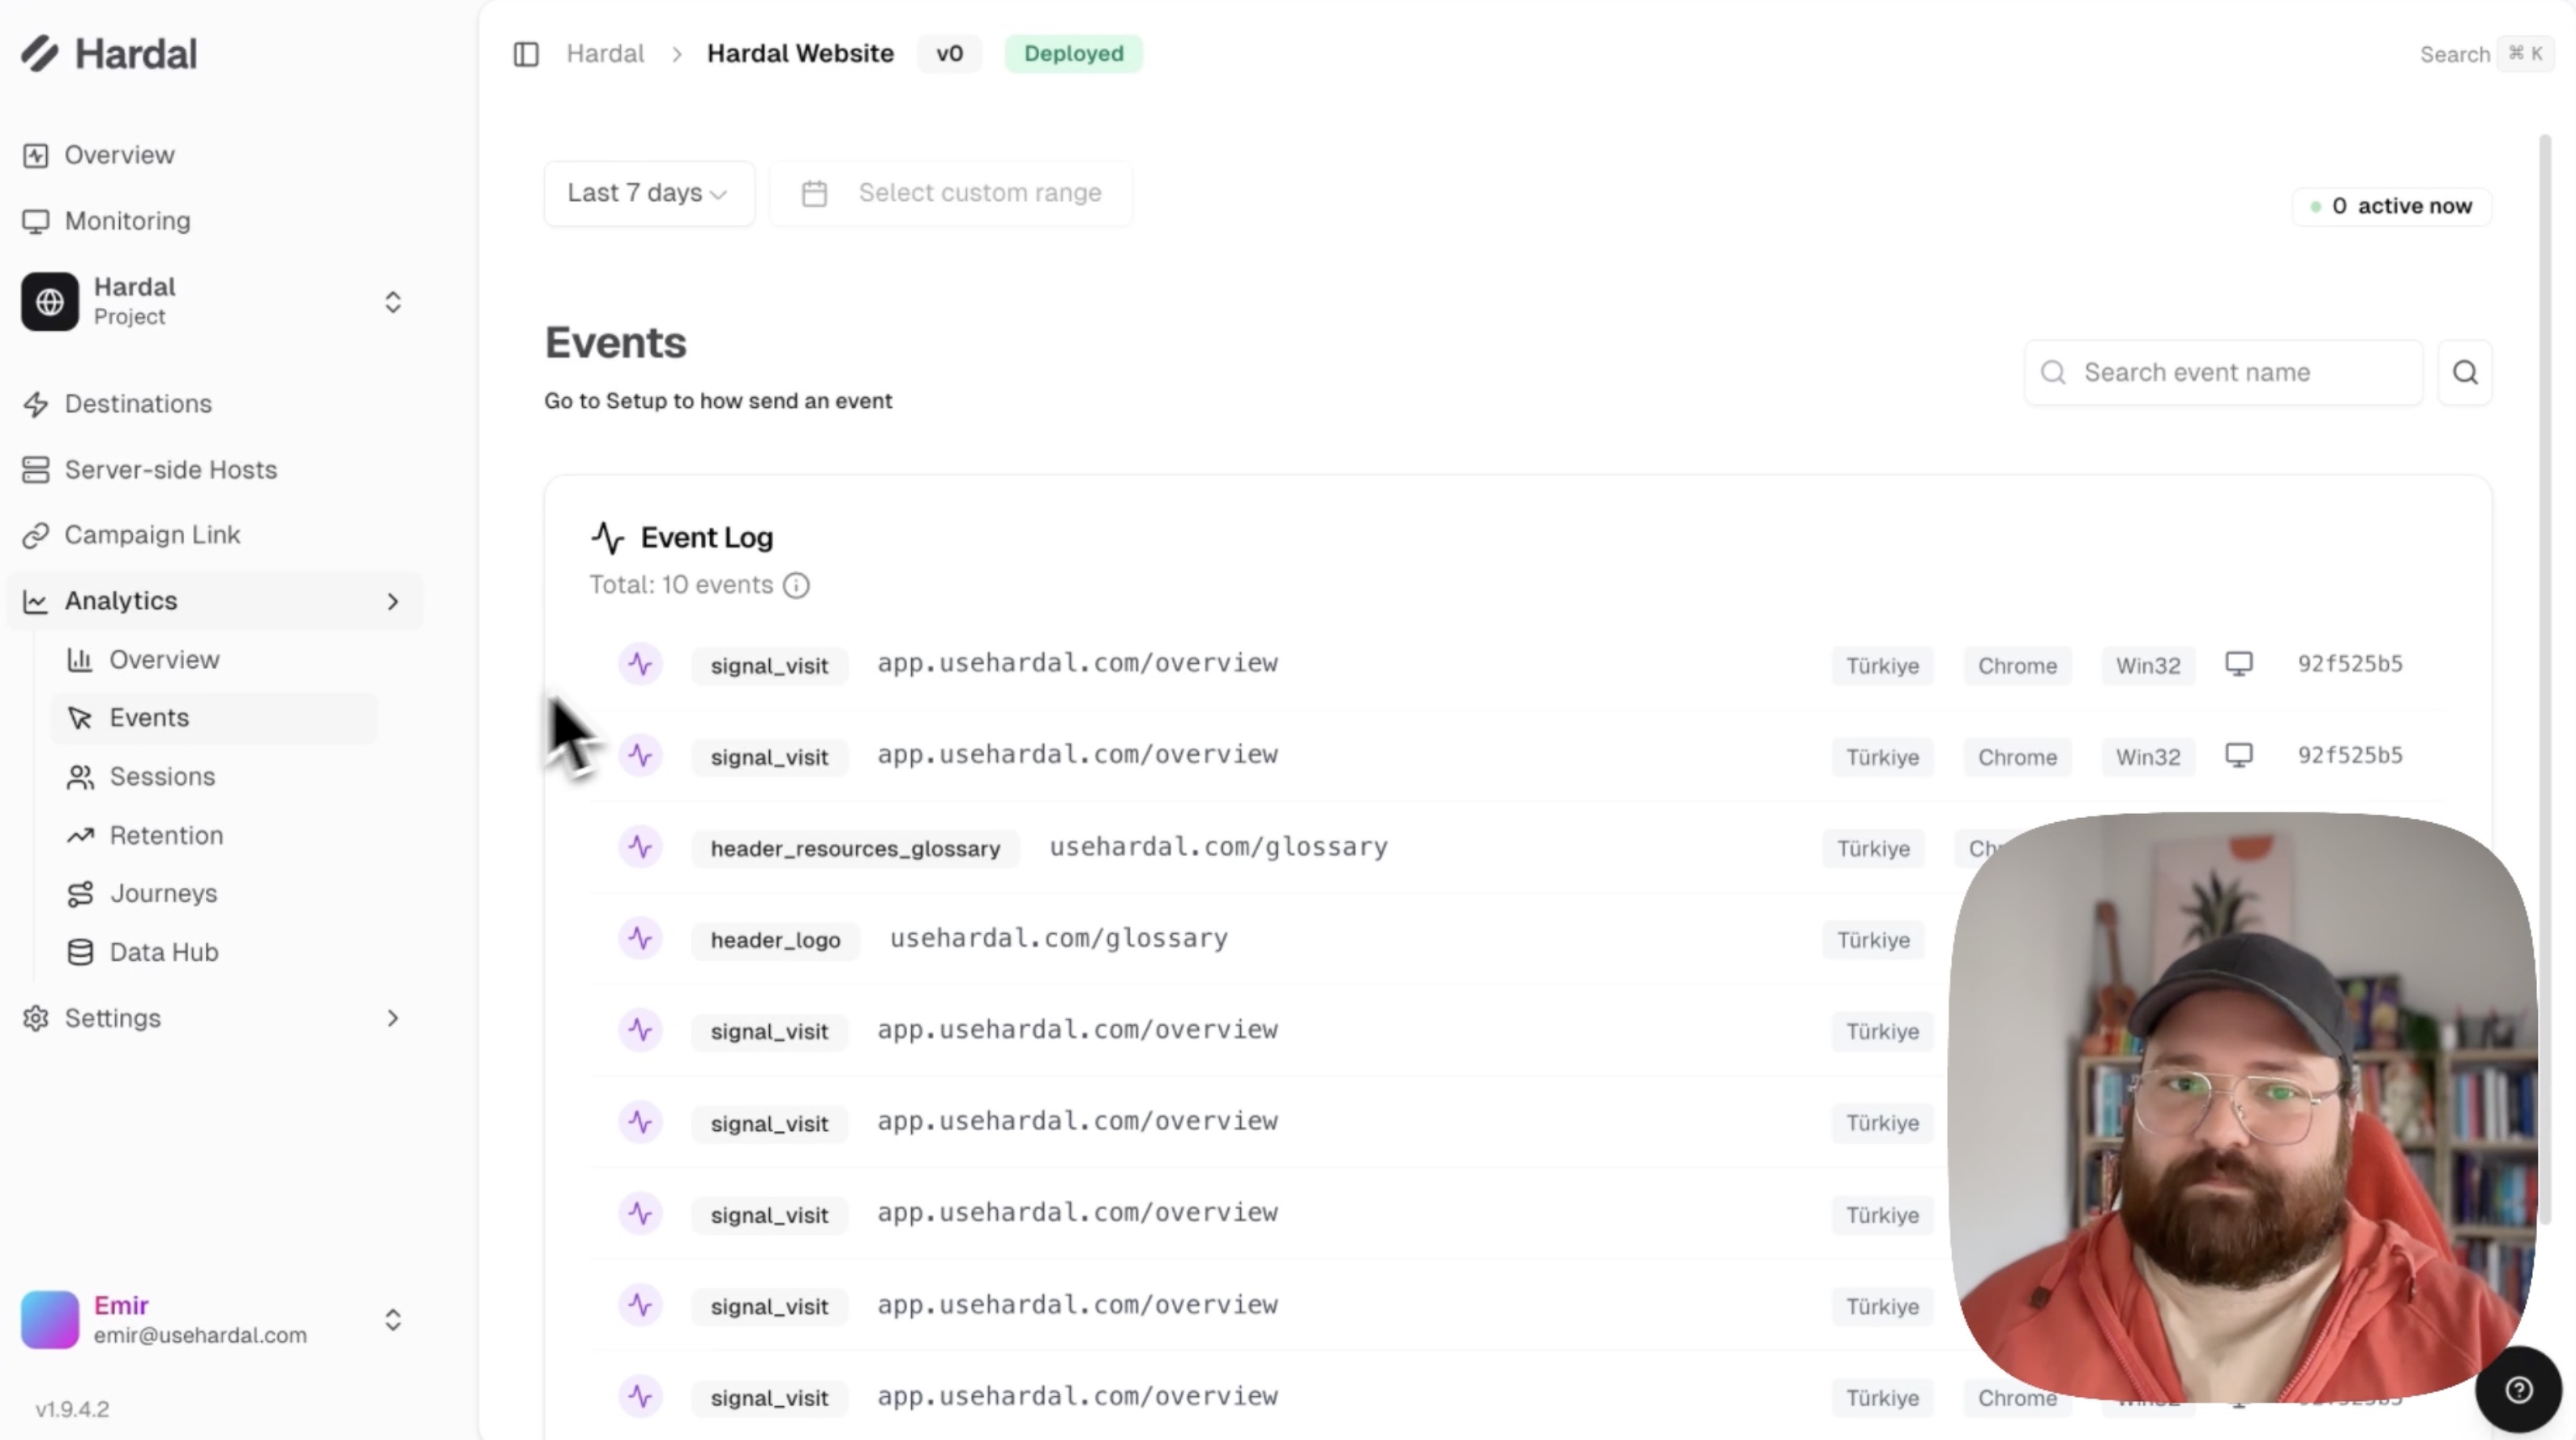
Navigate to your Hardal dashboard, select your signal, and click Analytics > Overview from the left menu.
Key Metrics
The top section displays essential metrics:
- Visitors: Unique users visiting your website
- Sessions: Total browsing sessions
- Page Views: Total pages viewed
- Custom Events: Any additional events you're tracking
You can adjust the date range using the date picker at the top (e.g., "Last 7 days").
Device and Browser Data
Scroll down to see detailed breakdowns of:
- Browsers: Which browsers your visitors use (Chrome, Firefox, Safari, etc.)
- Devices: Device types (Desktop, Mobile, Tablet)
- Operating Systems: OS distribution (Windows, macOS, iOS, Android, etc.)
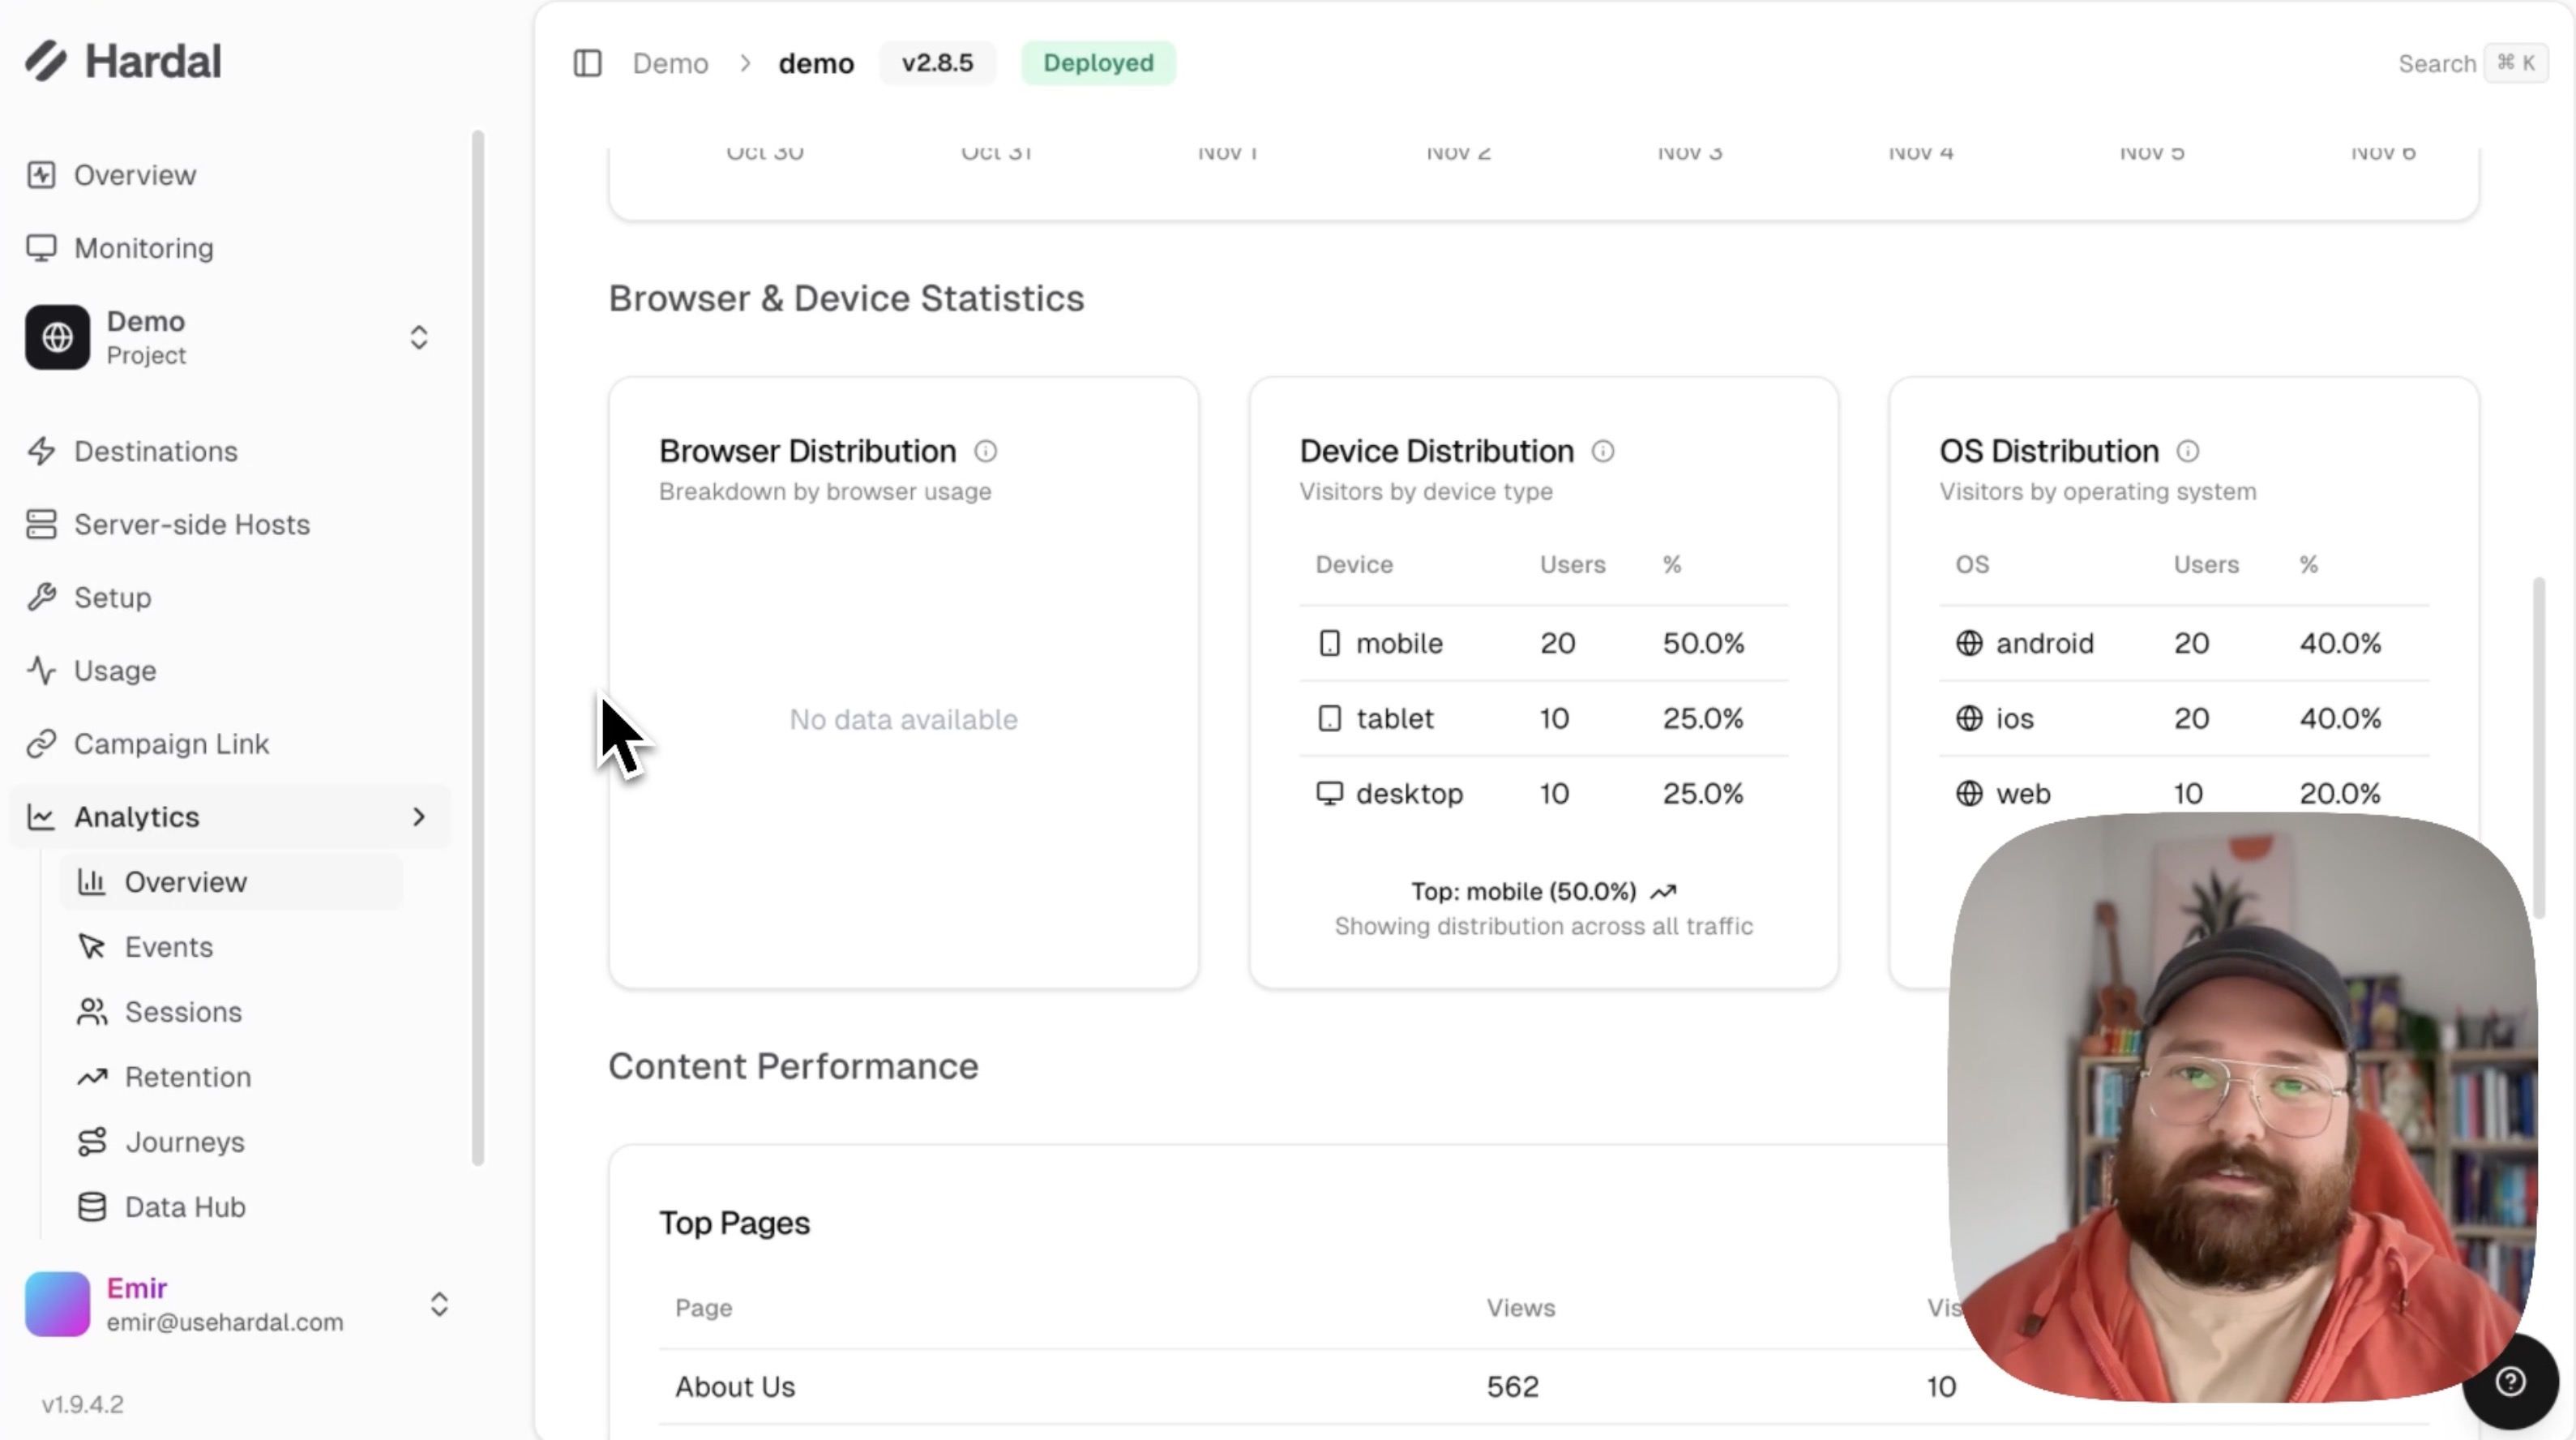
This information helps you optimize your website for your actual user base.
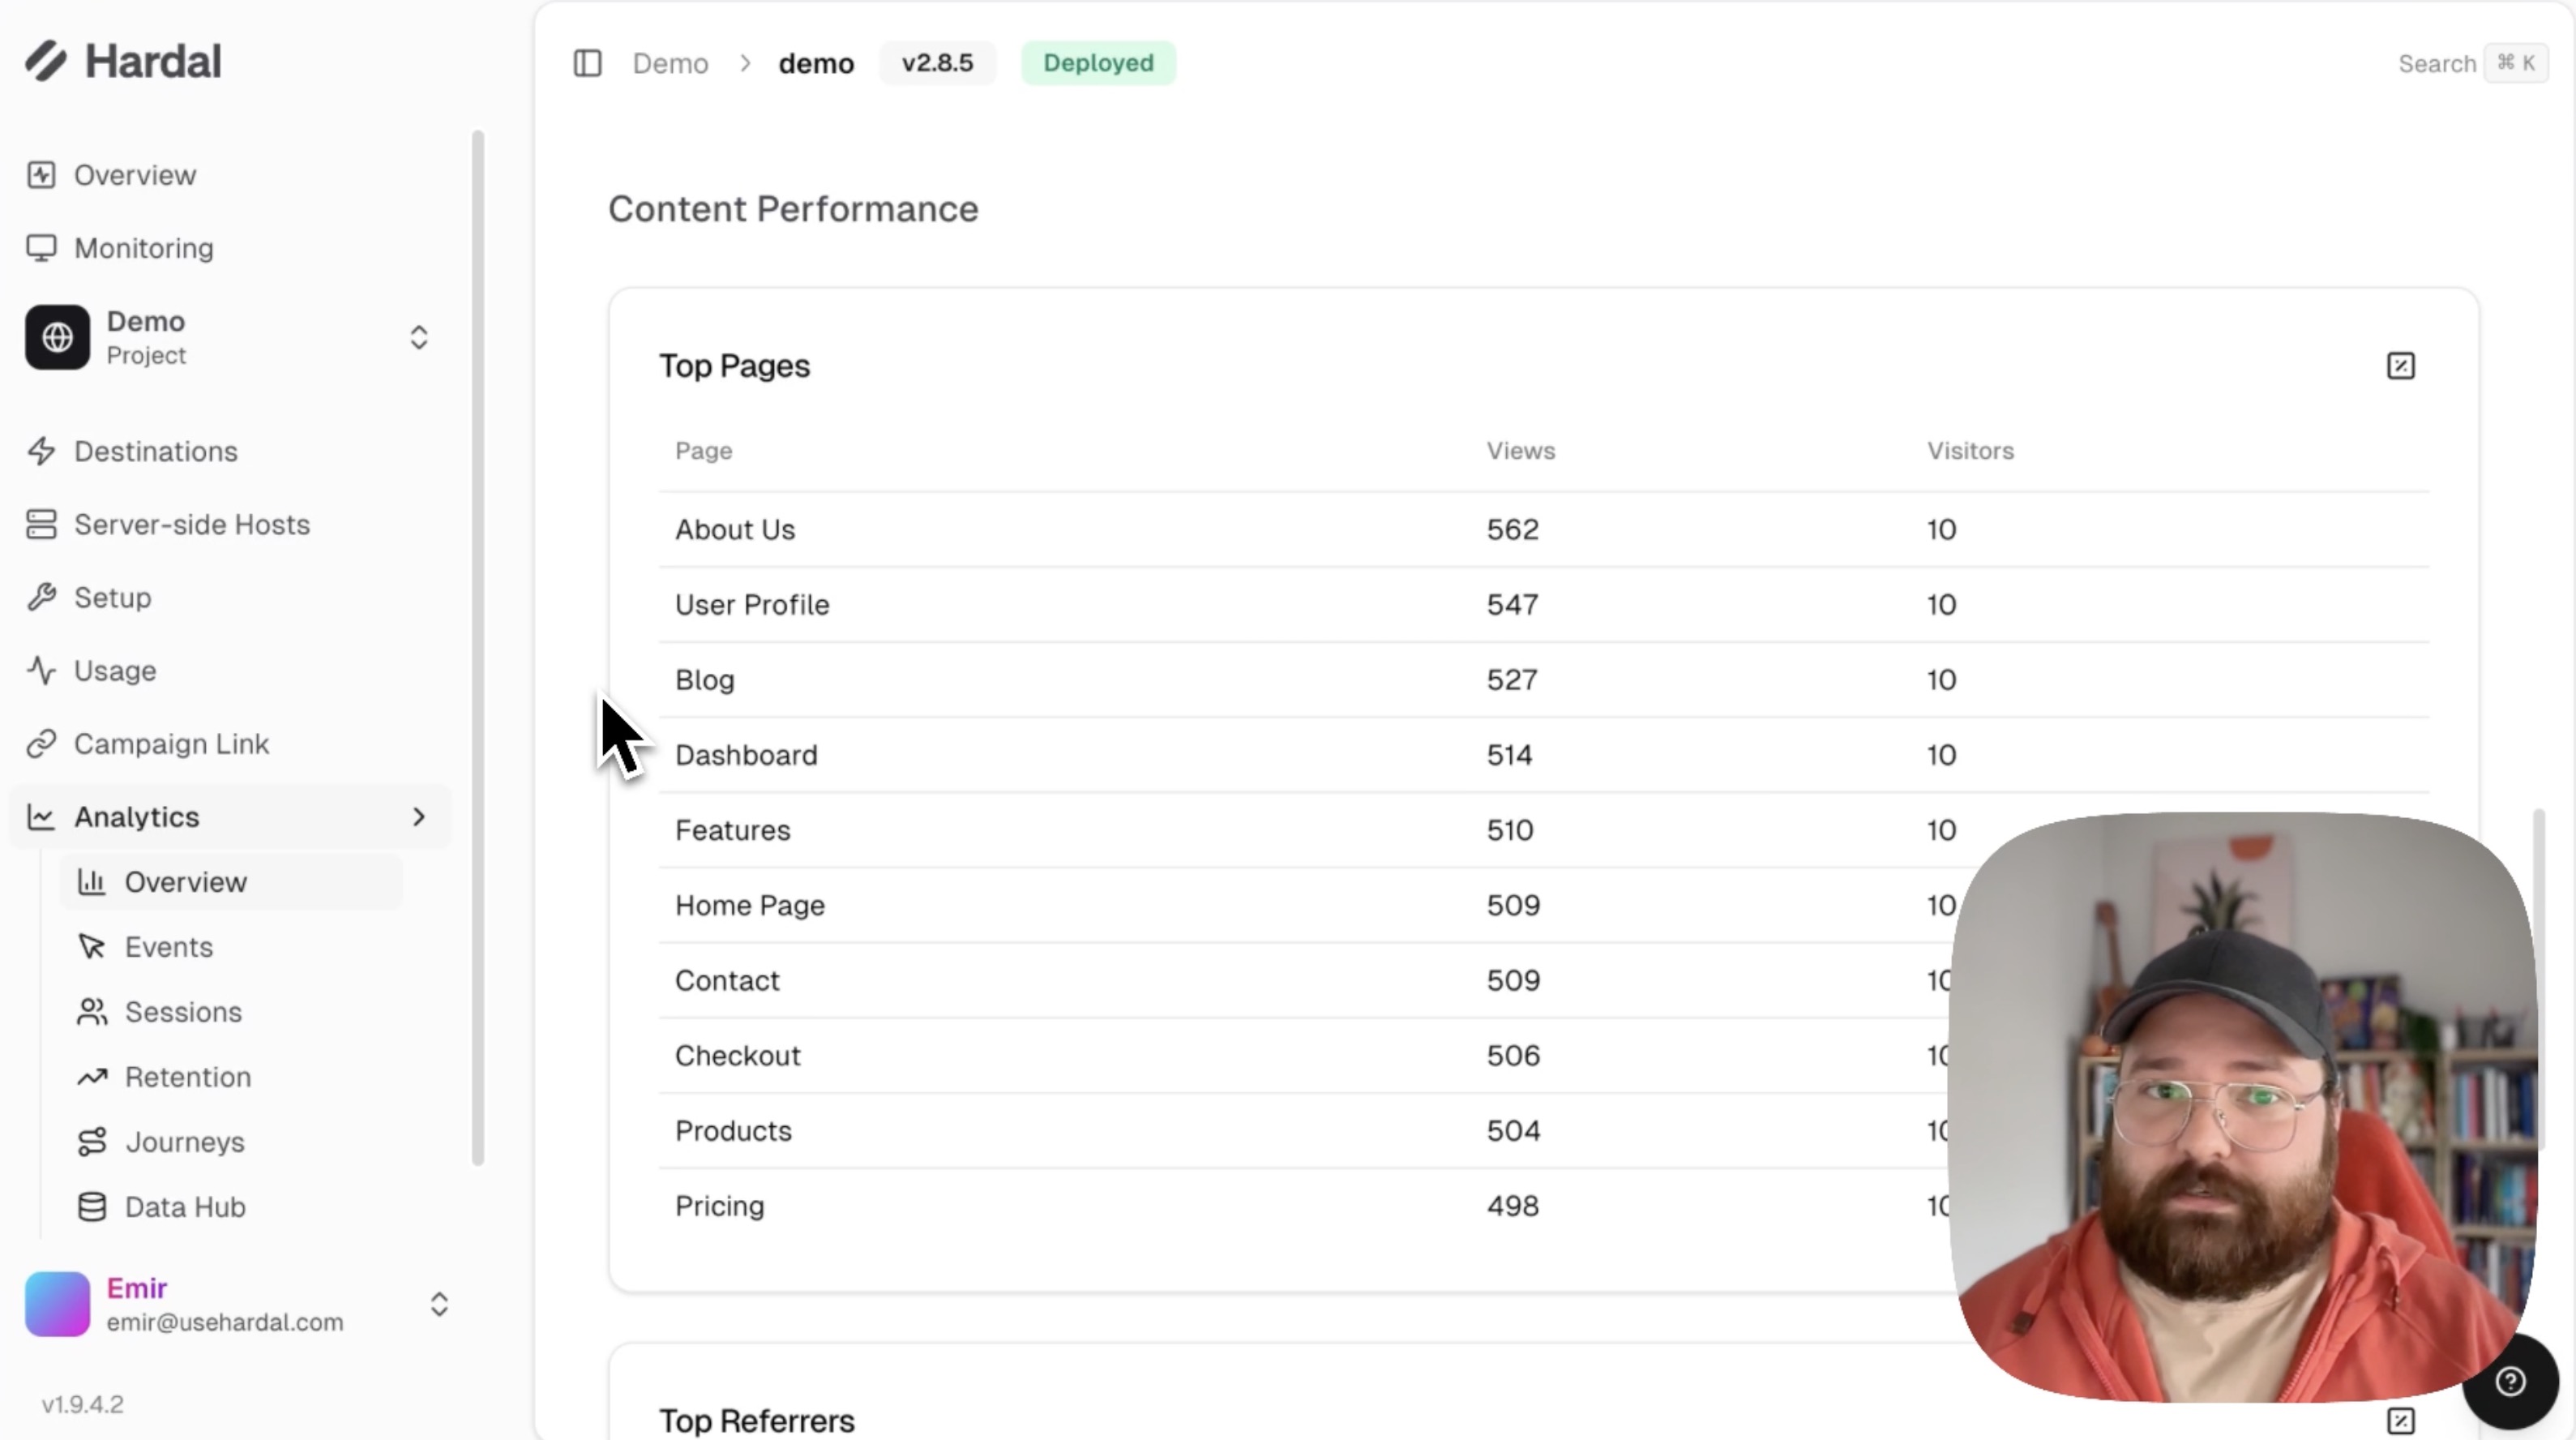
Traffic Analysis
Further down, you'll find:
Top Pages: Most visited pages on your website Top Referrers: Where your traffic is coming from Location Data: Geographic distribution of your visitors by country
Customizing Your Overview
To track specific events on the Overview page:
- Click on the Events button
- Add new custom events
- These events will appear in your metrics and graphs
This customization allows you to monitor the specific user actions that matter most to your business.
For a more detailed walkthrough, check out our step-by-step guide. Hardal Dashboard - Analytics Overview